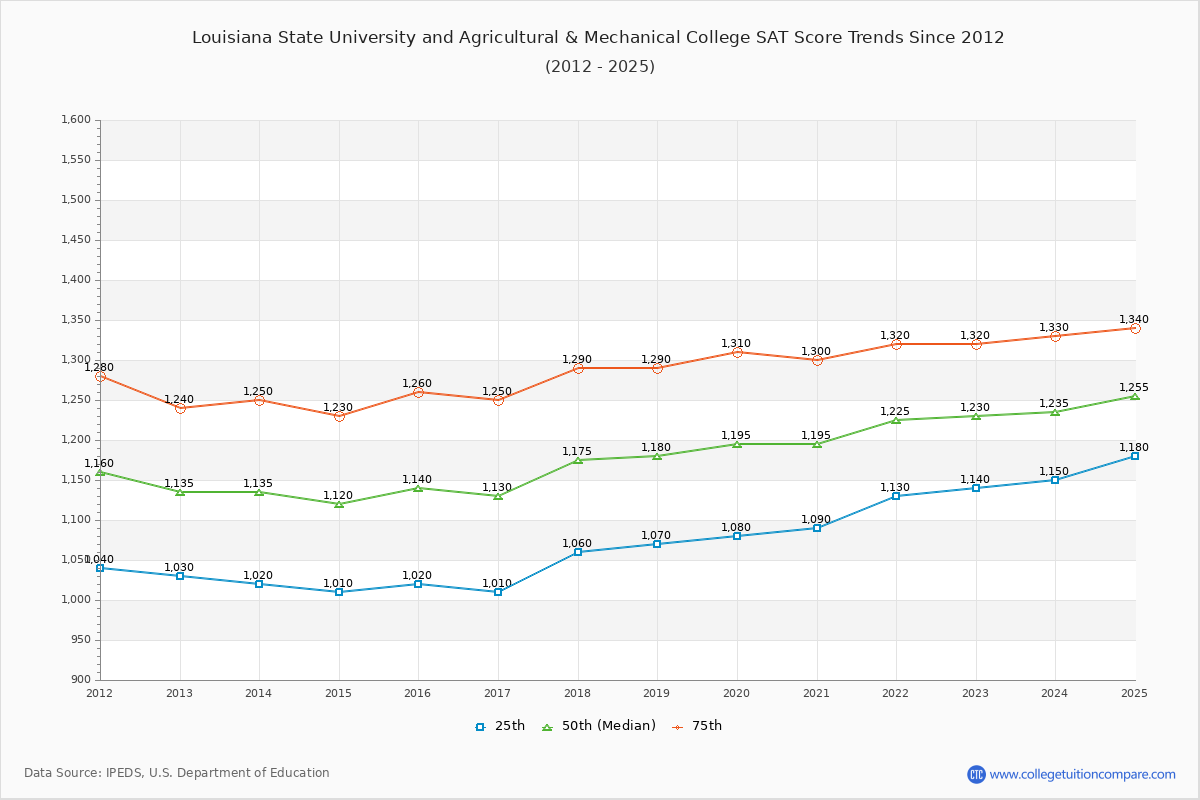
The SAT score have been increased 100 points since 2013. The SAT score has risen almost every year over the past decade, and have continued to rise especially recent years at LSU. Compared to previous year, the SAT score increased by 5 points at LSU. Compared to similar schools, the submitted SAT and ACT scores are relatively competitive and high (above the national average) at LSU.
You can check and compare colleges with similar SAT scores LSU by SAT score range 1135-1235, 1185-1285, and 1235-1335.
The 2024 SAT score is 1235 at LSU. Over the past 12 years, the average SAT score is 1071 (25 th percentile) and 1286 (75 th percentile). Compared to similar schools, the submitted SAT scores are relatively competitive and high (above the national average) at LSU.
The following table and chart illustrate the changes in SAT scores at Louisiana State University and Agricultural & Mechanical College since 2013.
| Year | Total | Math | Evidence-Based Reading and Writing | ||||||
|---|---|---|---|---|---|---|---|---|---|
| 25 th | 50 th | 75 th | 25 th | 50 th | 75 th | 25 th | 50 th | 75 th | |
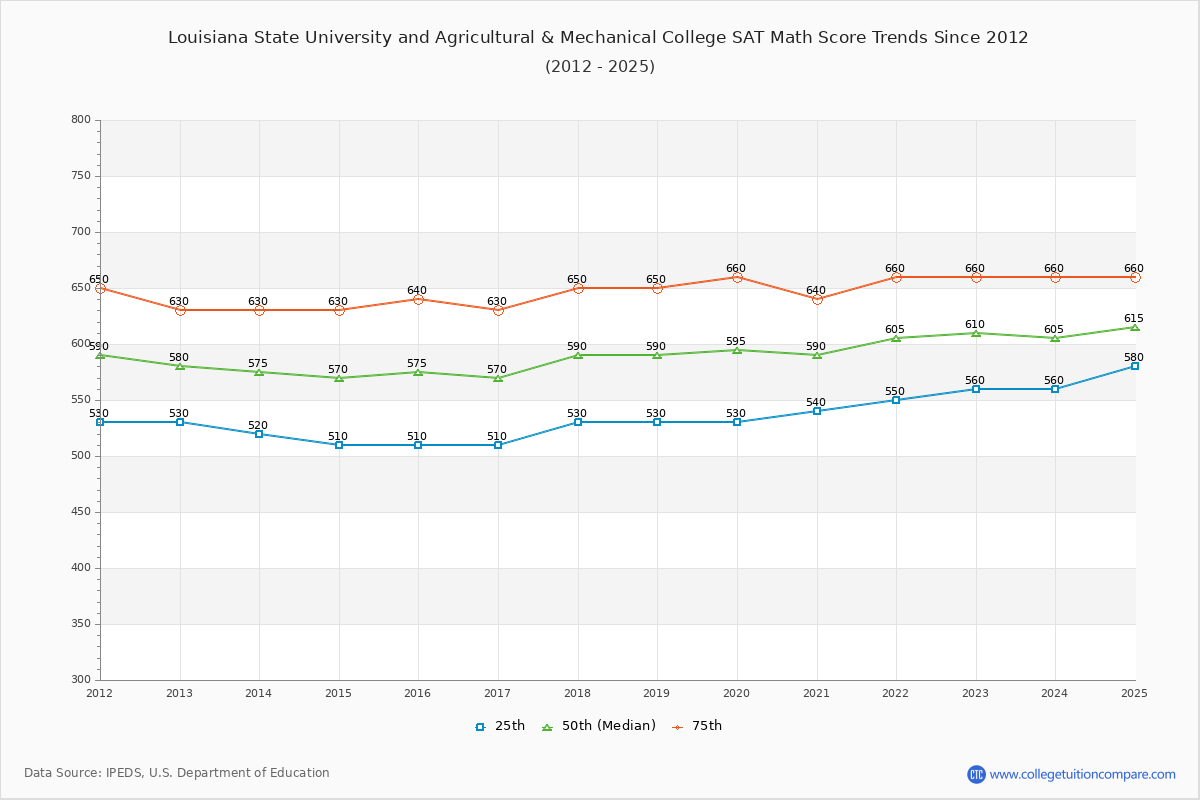
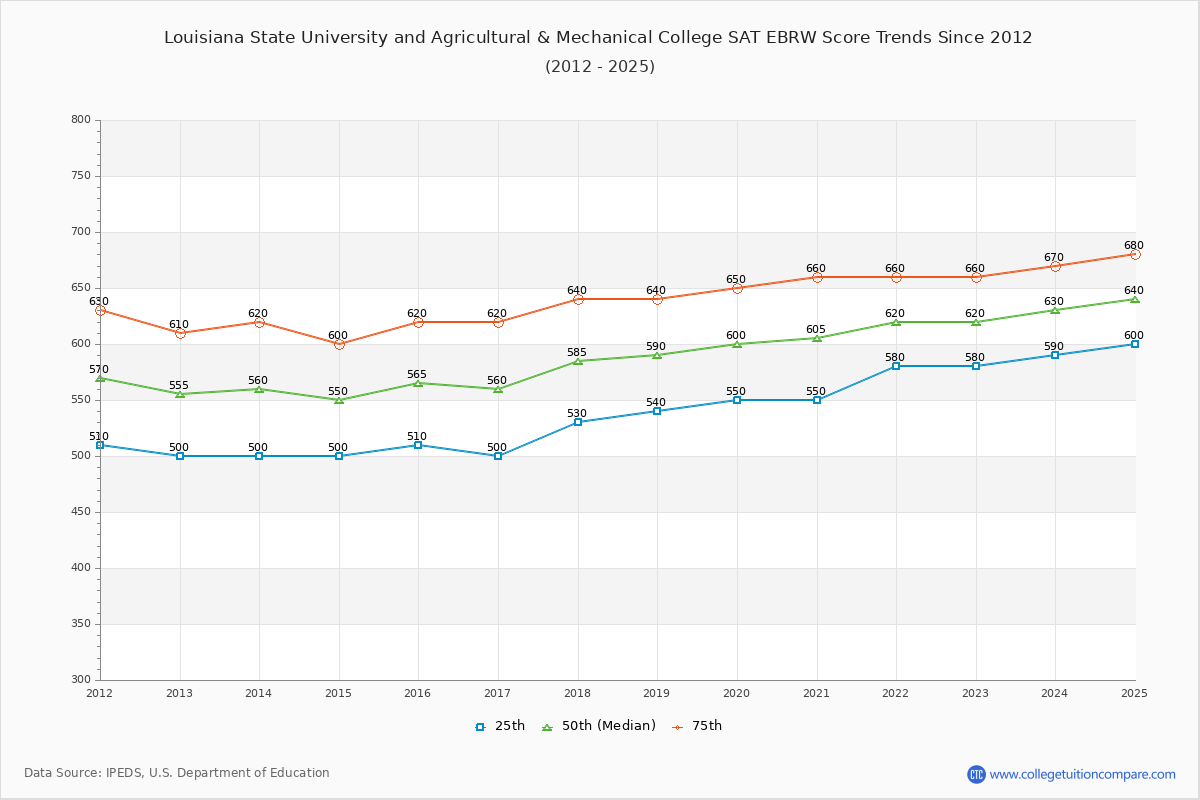
| 2013-14 | 1,020 | 1,135 | 1,250 | 520 | 575 | 630 | 500 | 560 | 620 |
| 2014-15 | 1,010 | 1,120 | 1,230 | 510 | 570 | 630 | 500 | 550 | 600 |
| 2015-16 | 1,020 | 1,140 | 1,260 | 510 | 575 | 640 | 510 | 565 | 620 |
| 2016-17 | 1,010 | 1,130 | 1,250 | 510 | 570 | 630 | 500 | 560 | 620 |
| 2017-18 | 1,060 | 1,175 | 1,290 | 530 | 590 | 650 | 530 | 585 | 640 |
| 2018-19 | 1,070 | 1,180 | 1,290 | 530 | 590 | 650 | 540 | 590 | 640 |
| 2019-20 | 1,080 | 1,195 | 1,310 | 530 | 595 | 660 | 550 | 600 | 650 |
| 2020-21 | 1,090 | 1,195 | 1,300 | 540 | 590 | 640 | 550 | 605 | 660 |
| 2021-22 | 1,130 | 1,225 | 1,320 | 550 | 605 | 660 | 580 | 620 | 660 |
| 2022-23 | 1,140 | 1,230 | 1,320 | 560 | 610 | 660 | 580 | 620 | 660 |
| 2023-24 | 1,150 | 1,235 | 1,330 | 560 | 605 | 660 | 590 | 630 | 670 |
| Average | 1071 | 1178 | 1286 | 532 | 589 | 646 | 539 | 590 | 640 |
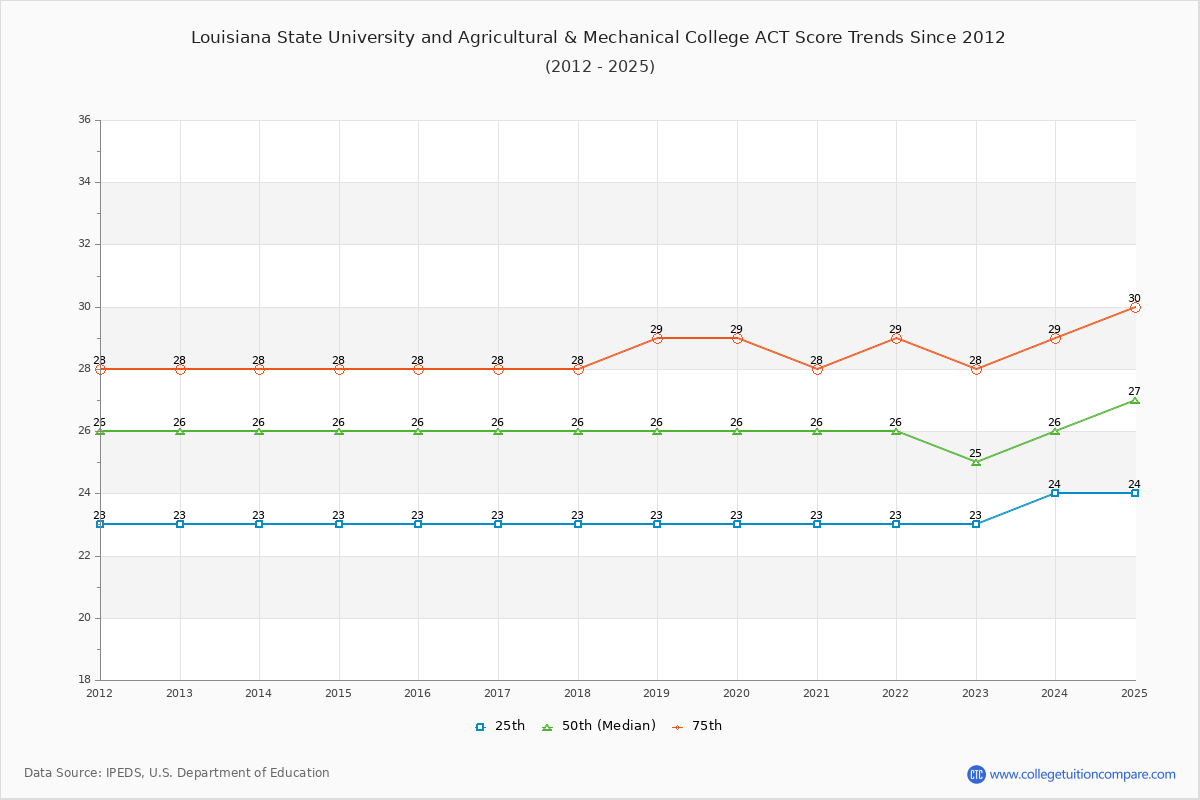
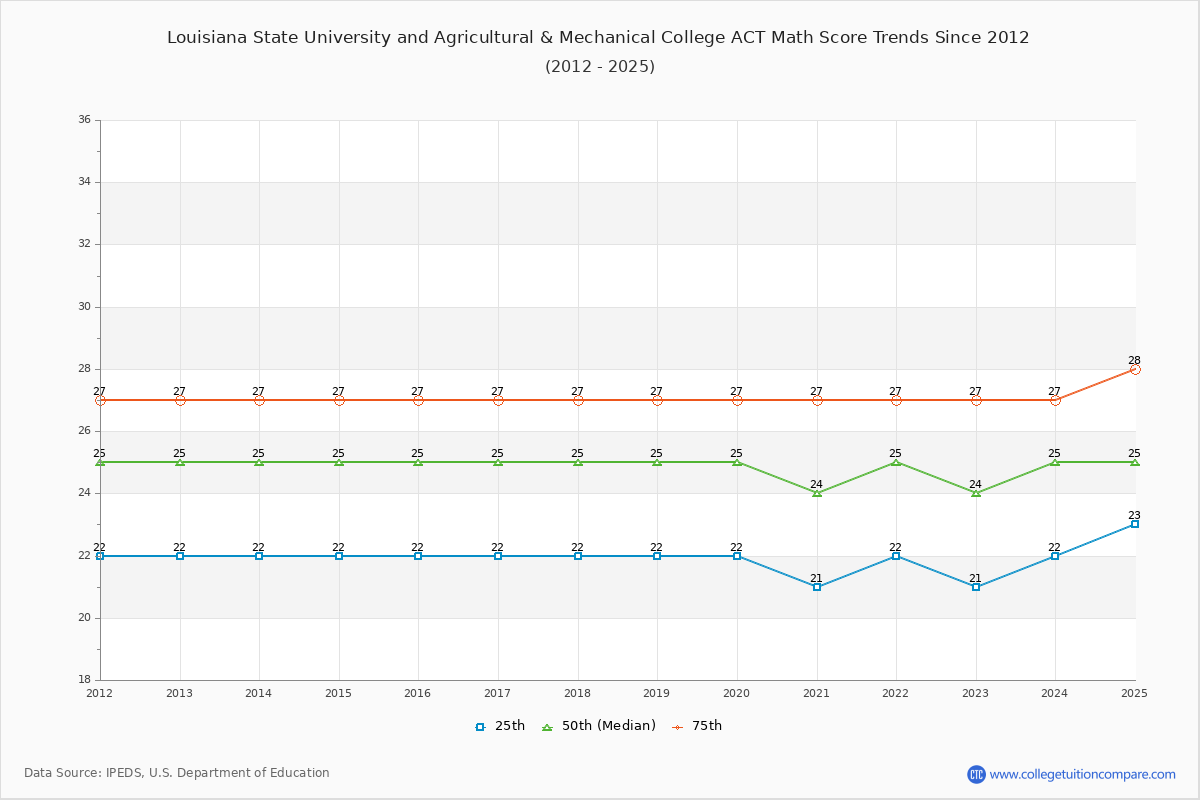
The 2024 ACT score is 26 at LSU. Over the past 12 years, the average ACT score of the last 12 years is 23 (25 th percentile) and 28 (75 th percentile). Compared to similar schools, the submitted ACT scores are relatively competitive and high (above the national average) at LSU.
The following table and chart show the changes in ACT scores at Louisiana State University and Agricultural & Mechanical College since 2013.
| Year | Composite | English | Math | ||||||
|---|---|---|---|---|---|---|---|---|---|
| 25 th | 50 th | 75 th | 25 th | 50 th | 75 th | 25 th | 50 th | 75 th | |
| 2013-14 | 23 | 26 | 28 | 23 | 26 | 29 | 22 | 25 | 27 |
| 2014-15 | 23 | 26 | 28 | 23 | 27 | 30 | 22 | 25 | 27 |
| 2015-16 | 23 | 26 | 28 | 23 | 27 | 30 | 22 | 25 | 27 |
| 2016-17 | 23 | 26 | 28 | 23 | 27 | 30 | 22 | 25 | 27 |
| 2017-18 | 23 | 26 | 28 | 23 | 27 | 31 | 22 | 25 | 27 |
| 2018-19 | 23 | 26 | 29 | 23 | 27 | 31 | 22 | 25 | 27 |
| 2019-20 | 23 | 26 | 29 | 23 | 28 | 32 | 22 | 25 | 27 |
| 2020-21 | 23 | 26 | 28 | 23 | 28 | 32 | 21 | 24 | 27 |
| 2021-22 | 23 | 26 | 29 | 23 | 28 | 32 | 22 | 25 | 27 |
| 2022-23 | 23 | 25 | 28 | 23 | 26 | 31 | 21 | 24 | 27 |
| 2023-24 | 24 | 26 | 29 | 23 | 26 | 31 | 22 | 25 | 27 |
| Average | 23 | 26 | 28 | 23 | 27 | 31 | 22 | 24 | 27 |
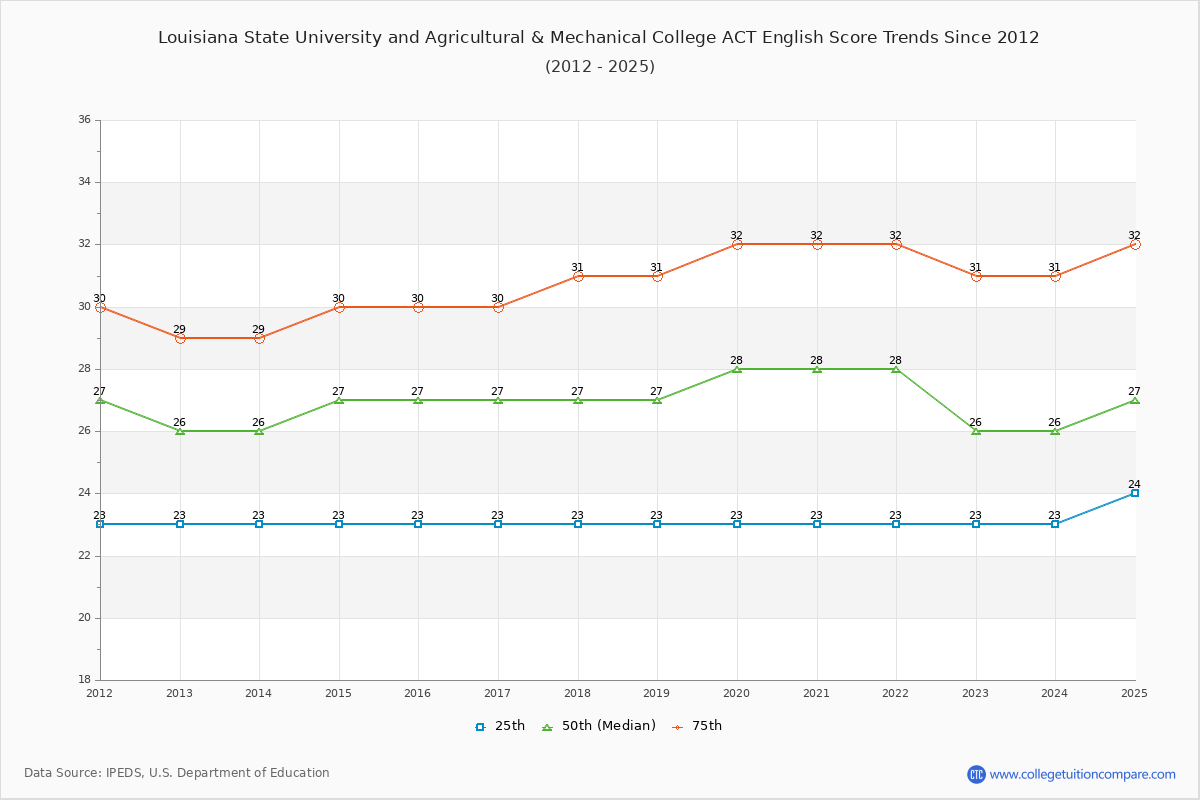 English Trends Chart" />
The following table compares SAT score changes from last year between Louisiana State University and Agricultural & Mechanical College and similar schools.
| 2024 | 2023 | Change % | |
|---|---|---|---|
| Louisiana State University and Agricultural & Mechanical College | 1230 | 1225 | 0.41% |
| Texas A & M University-College Station | 1270 | 1260 | 0.79% |
| University of Mississippi | 1120 | 1125 | -0.44% |
| The University of Tennessee-Knoxville | 1240 | 1255 | -1.20% |
| Auburn University | 1300 | - | - |
| University of Arkansas | 1110 | 1135 | -2.20% |
Share your experiences and thoughts about Louisiana State University and Agricultural & Mechanical College. It will be a great help to applicants and prospective students!